
Market Heatmap in Slack: Post One Automatically

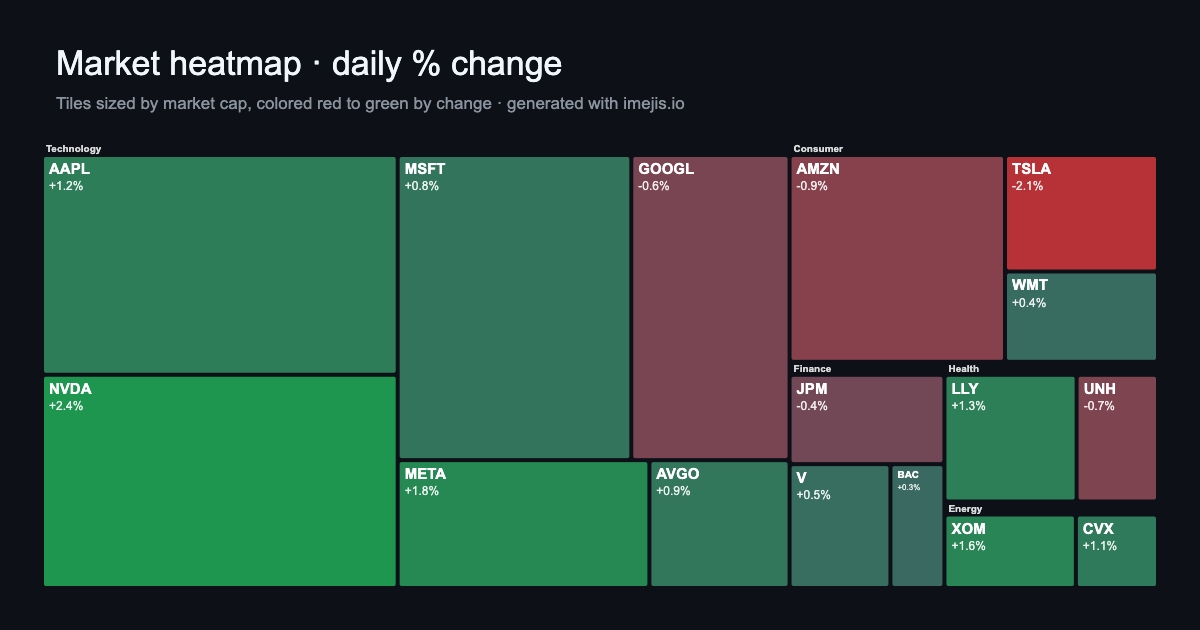
Every morning your team wants the same thing in Slack: a quick read on the market. Not a wall of tickers, a picture. The Finviz-style map where the whole market's mood shows up in one glance, green for up, red for down, big names as big tiles.
So you try to post it, and Slack shows nothing useful. A link that unfurls into a login page, or a chart that just won't render. Because Slack doesn't run live charts. It shows images.
Here's how to post a market heatmap to Slack, and how to make it show up on its own every morning.
What a market heatmap actually isWhat a market heatmap actually is
A market heatmap is a treemap. Each tile is a stock: its size is the market cap, its color is the day's percentage change, green when it's up and red when it's down. Group the tiles by sector and you get the classic Finviz market map, the one that tells you "tech's up, energy's flat, one big red block in consumer" without reading a single number.
Here's one rendered from data, the kind of image you'd drop in a channel:
That's the target. Now the two pieces to get it into Slack.
Why slack needs an image not a chartWhy Slack needs an image, not a chart
Slack messages can't run JavaScript. A charting library needs a browser and a canvas to draw on, and a Slack channel gives it neither. What Slack does render is an image block: you hand it a public image URL and an alt text, and it shows the picture inline.
So the job splits cleanly in two:
- Turn your market data into a heatmap image.
- Post that image to Slack with a webhook.
Do both on a schedule and you've got a hands-off daily recap.
Your optionsYour options
| Approach | Automatic | Your own tickers | Effort |
|---|---|---|---|
| Screenshot Finviz and paste | No | Finviz's universe only | Manual, every morning |
| Build the renderer yourself | Yes | Yes | High: headless browser plus treemap layout |
| Chart image API plus Slack webhook | Yes | Yes | Low: POST data, POST image |
Screenshotting Finviz works until you want your own watchlist, or you get tired of doing it at 9am. Building your own treemap renderer is real work, squarified layout and a headless browser to babysit. For most teams the third row wins, so that's what the rest of this walks through.
Step 1 turn data into a heatmap imageStep 1: turn data into a heatmap image
The heatmap is a treemap component. Each row is a tile with a label, a size value (market cap), and a change value (the day's move) that drives the color:
POST https://render.imejis.io/v1/YOUR_DESIGN_ID
{ "market": { "data": [
  { "label": "AAPL", "value": 3400, "change": 1.2 },
  { "label": "NVDA", "value": 3300, "change": 2.4 },
  { "label": "TSLA", "value": 800, "change": -2.1 }
] } }
You design the treemap once, mark its data dynamic, and every POST gives you back a fresh PNG. Want to try it without code first? Paste your tickers into the free market heatmap / treemap maker, tweak the colors, and download the image. No signup.
Step 2 post the image to slackStep 2: post the image to Slack
Slack's incoming webhooks take a JSON payload. Use an image block and point it at your rendered PNG:
curl -X POST 'https://hooks.slack.com/services/YOUR/WEBHOOK/URL' \
  -H 'Content-Type: application/json' \
  -d '{
    "blocks": [
      { "type": "header", "text": { "type": "plain_text", "text": "Market recap" } },
      {
        "type": "image",
        "image_url": "https://render.imejis.io/v1/YOUR_DESIGN_ID?market=...",
        "alt_text": "Market heatmap for today"
      }
    ]
  }'
Slack fetches that image_url and renders it in the channel. The one rule that trips people up: the URL has to be a public https link that returns the image directly. A localhost address, a private file, or a link to a page won't render. A hosted image URL will.
Put it on a schedulePut it on a schedule
String the two steps together and run them every weekday morning:
- Pull the numbers. Market cap and percentage change per ticker, from your data provider or a spreadsheet.
- Render the heatmap. POST that data to the chart image API, get back an image.
- Post to Slack. Send the image URL to your channel's webhook.
A cron job does this in about fifteen lines. So does a Zap or a Make scenario if you'd rather not host anything. Either way, the map shows up at 9am and nobody lifts a finger.
A few things to watchA few things to watch
- The image URL must be public. Slack's servers fetch it, not your browser, so it can't be behind a login or on localhost.
- Slack caches images. If you reuse the exact same URL, Slack may show the old picture. Add a changing query param (a date) so each day's map is treated as new.
- Always set alt_text. It's what screen readers announce, and what shows if the image can't load.
- Keep it readable at Slack width. A heatmap with 200 tiny tiles turns to mush in a channel. Top 20 to 30 names reads best.
Which way to goWhich way to go
- You just want today's map, once: screenshot Finviz, or build one in the treemap maker and paste it in.
- You want it every morning, with your tickers: a chart image API plus a Slack webhook on a schedule. It's the only setup that stays correct without someone remaking the image.
For a recurring recap, the question that decides it is the same one as always: will this still be right tomorrow without me touching it? A screenshot won't. The API will.
Wrapping upWrapping up
A market heatmap in Slack comes down to two moves: render the treemap as an image, then post that image with a webhook. Slack won't run a live chart, but it'll happily show a PNG, so you turn your market data into one and let a schedule do the rest.
Start free with 100 chart images a month, or build a heatmap right now in the treemap maker. Posting charts to email too? Here's how to add charts to HTML email, and how to pull the data from Google Sheets.