
GitHub Stats Card Generator
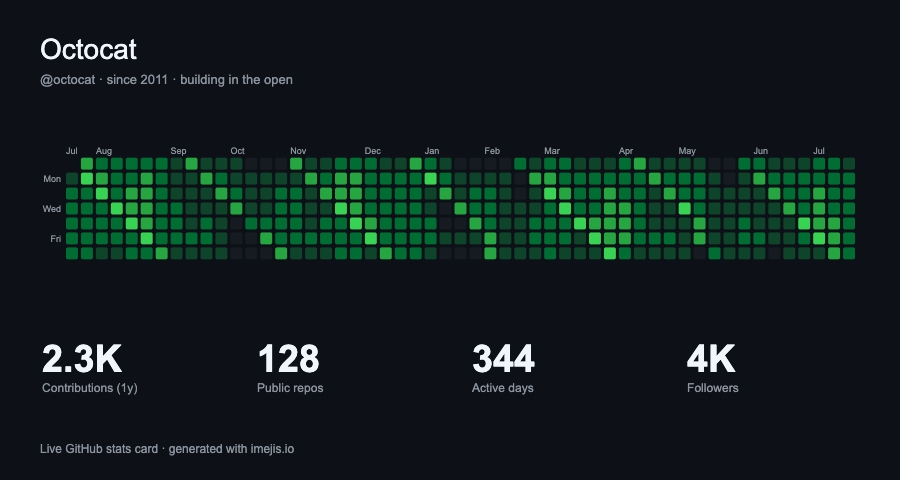
Type any GitHub username and get a live stats card, the full contribution heatmap plus contributions, repos, active days, and followers. Download a PNG for your README or profile. No signup, no token, no watermark.
Theme
Layout
Six built-in themes
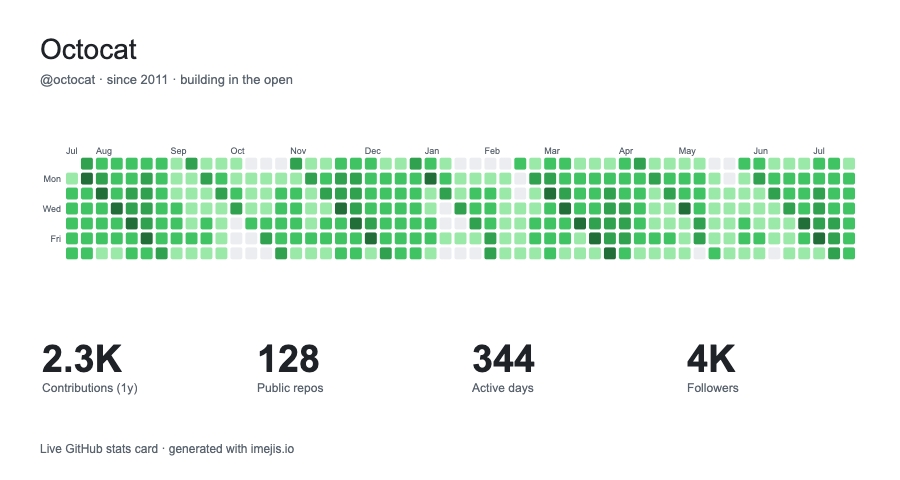
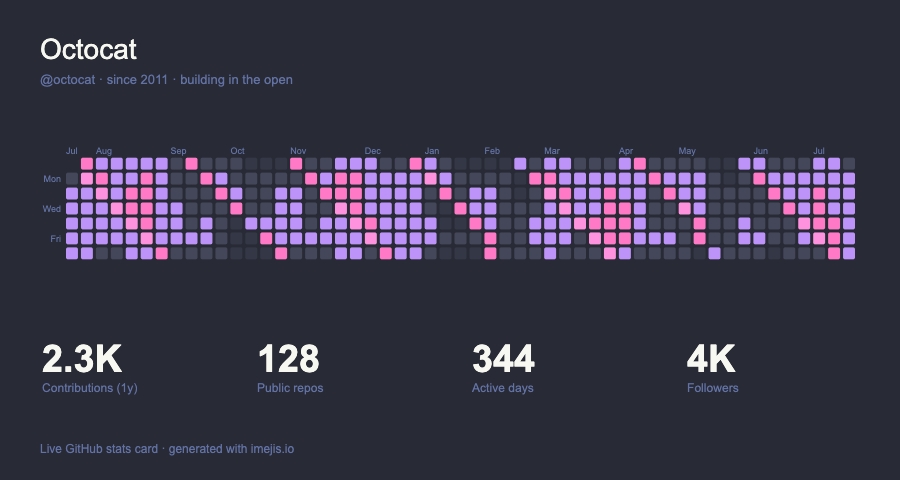
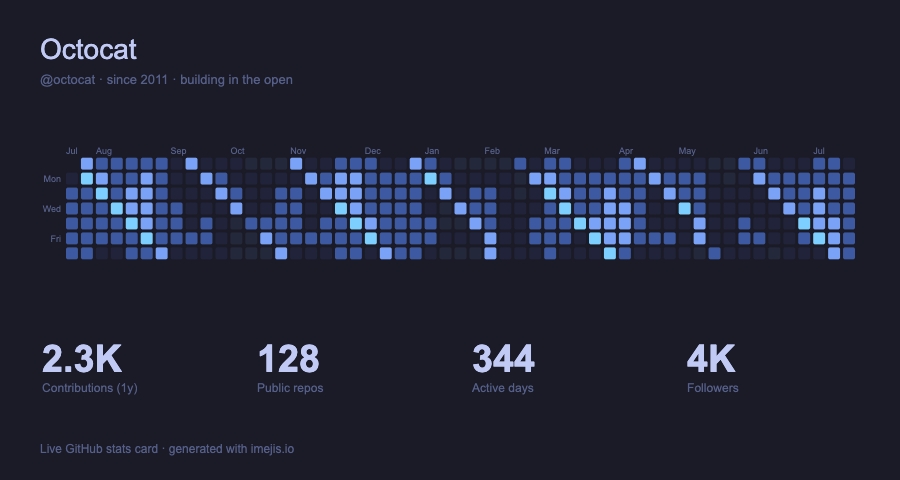
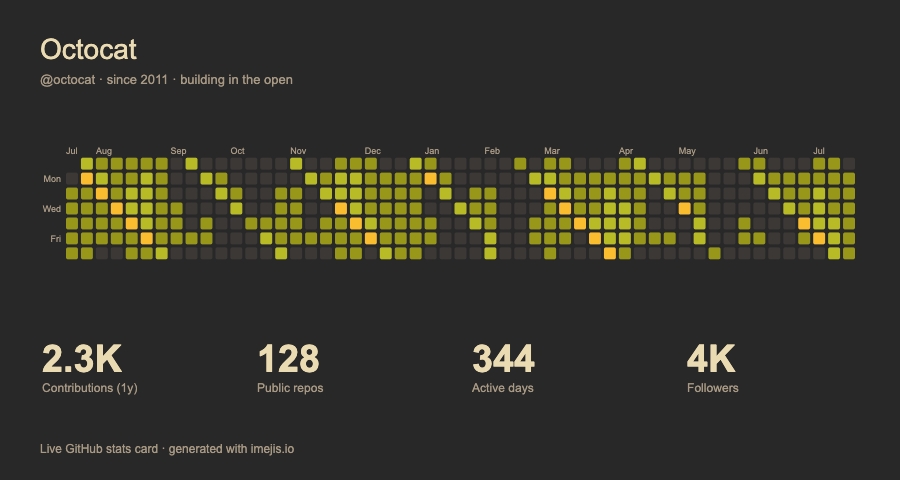
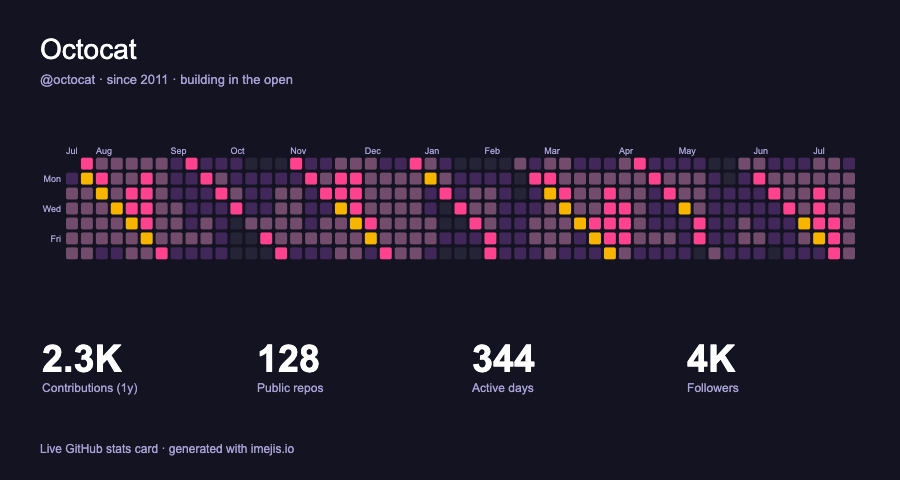
Match your profile or your terminal. Pick a theme and the whole card, heatmap included, recolors instantly, then download it as a crisp PNG.
What is a GitHub stats card?
A GitHub stats card is a single image that sums up a developer's public activity. It pairs the year-long contribution heatmap, the green grid you see on a profile, with headline numbers like total contributions, public repos, active days, and followers. It's the fastest way to show what you've been building without sending someone to your profile page, which is why it's a staple at the top of README files and portfolios.
How to make a GitHub stats card
- 1Type a username. Enter any public GitHub username. The tool fetches that account's public data live, no login and no token to paste.
- 2Watch the card build. The contribution heatmap and the headline numbers draw into a card in real time, exactly as they'll export.
- 3Download the PNG. Click download for a high-resolution image, ready for a README, a portfolio, or a post. No watermark and no signup.
- 4Keep it fresh via API (optional). Save the card as an Imejis template, mark its heatmap and metrics dynamic, and POST new numbers to render an updated card on a schedule.
What can you use it for?
- A living stats badge at the top of your GitHub profile README
- A developer portfolio or personal site header
- A "year in review" contribution recap to share
- Team or open-source maintainer activity snapshots
- A daily-updating card driven by the API
Built from real chart components
This isn't a one-off template. The card is a normal Imejis design made from a calendar-heatmap component and four metric components. That's the difference from a static badge service: you can open the same design in the editor, restyle it, swap the data, or drive it from the API to render a fresh card on every call. See all 19 chart and data components you can compose the same way.
Automate it with the image API
Drop the PNG in your repo for a static badge, or rebuild the card programmatically. It's a design made of a calendar-heatmap and metric components, so you can POST fresh numbers to the imejis render API and get a new image on every call, straight from your own script or cron job.
The free plan includes 100 API renders a month. Upgrade only when you need more.