
HTML Email Charts: How to Add Charts That Render

You built the chart. It looks great in the browser. Then you sent yourself a test, opened it in Gmail, and... nothing. A blank rectangle where the chart should be. Maybe a broken-image icon if you're unlucky.
If you've hit this, you're not doing anything wrong. HTML email charts are one of those problems that seem simple until you actually try it. The short version: the chart library you're using needs JavaScript, and email doesn't run JavaScript. So the chart never draws.
This guide covers why that happens, and the one approach that actually works in every inbox: sending the chart as an image.
Why charts break in html emailWhy charts break in HTML email
Email clients are not browsers. That's the whole thing in one sentence.
A web page can run Chart.js, D3, Recharts, whatever you like, because the browser gives them a <canvas> or an SVG root and a JavaScript engine to draw with. Gmail, Outlook, Apple Mail, and Yahoo give them none of that. Here's what gets stripped:
- JavaScript: every major client removes
<script>tags. No JS means no client-side chart library runs. Ever. - The canvas element:
<canvas>isn't supported, so anything that draws to a canvas (Chart.js, most charting libs) has no surface to paint on. - Most CSS: Outlook on Windows renders with Microsoft Word's engine. Flexbox, grid, and half of modern CSS just don't apply.
- SVG, often: even hand-written SVG charts are stripped or ignored in Gmail, Outlook, and a bunch of mobile clients. You can check any feature at caniemail.com before you rely on it.
So the "add a chart to my email" problem isn't really about charts. It's about the fact that email is a 1998-era rendering target wearing a modern outfit. The only visual element every client agrees to show is a plain old image.
The fix send the chart as an imageThe fix: send the chart as an image
Here's the move. Instead of shipping chart code and hoping the inbox runs it, you render the chart to a PNG once, host it somewhere public, and reference it with a normal <img> tag:
<img
  src="https://cdn.example.com/charts/q3-revenue.png"
  width="600"
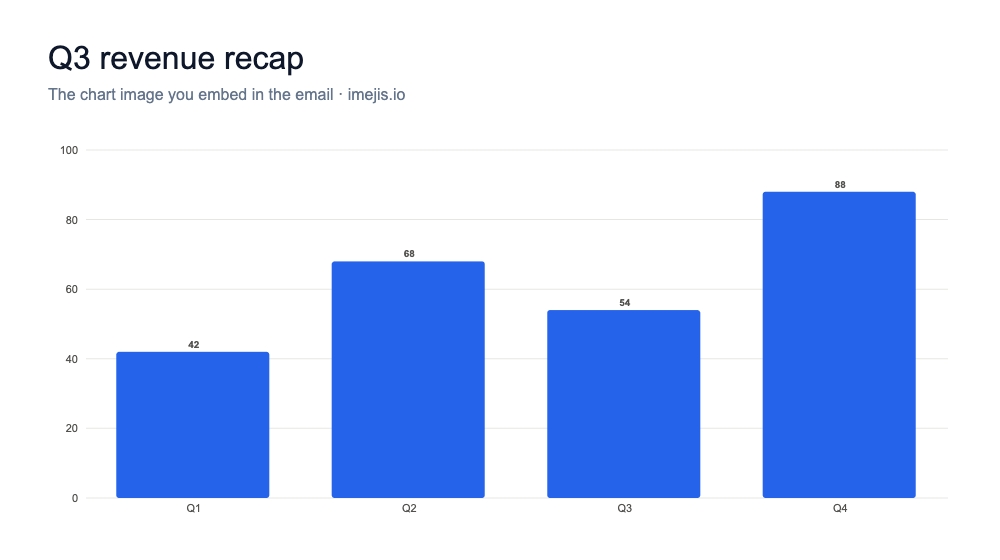
  alt="Q3 revenue: 42k, 68k, 54k, 88k across the quarter"
/>
Here's a real example of the kind of chart image that goes in that <img> tag, a designed PNG built from data, not a screenshot:
That's it. Gmail shows it. Outlook shows it. Your grandmother's Yahoo account from 2006 shows it. An image is the one thing they all render, because it asks nothing of them.
Two things to get right, though, and they trip people up:
- Host the image at an absolute URL. Email has no "current page," so relative paths break. It needs the full
https://address. - Write real alt text. A lot of clients block images by default until the reader clicks "show images." Good alt text ("Q3 revenue up 40%") means your chart still communicates something before it loads. It's also better for accessibility and screen readers.
How to make the chart imageHow to make the chart image
You've got a few ways to produce that PNG. They trade off effort against how automated you need it. Here's the honest rundown.
| Approach | Renders in Gmail & Outlook | Personalized per recipient | Effort |
|---|---|---|---|
| Screenshot a chart by hand | Yes | No | Manual, every single send |
| Self-host a headless browser | Yes | Yes | High: run and babysit Chromium |
| QuickChart (open-source URL) | Yes | Yes | Medium: hand-write Chart.js config in a URL |
| Chart image API (Imejis) | Yes | Yes | Low: design once, POST your data |
A screenshot is fine for a one-off. If you send the same static chart in a monthly newsletter and the numbers rarely change, honestly, just screenshot it and move on. No tool needed.
It falls apart the moment the data changes or you want a chart per person. Screenshotting 5,000 usage charts by hand is not a plan, it's a punishment.
QuickChart is the open-source option worth knowing about. You pass a Chart.js config as URL parameters and it hands back an image. It's free on the public endpoint and self-hostable. The catch is you're writing raw Chart.js JSON by hand, inside a URL, and the default styling reads like, well, default Chart.js. Fine for engineers who like config. Rough if you want it to look designed.
The no code way a free chart toolThe no-code way: a free chart tool
If you just need one good-looking chart image and you don't want to touch an API, use a browser chart maker. Open the free chart tools, pick a type, paste your numbers, and download a PNG. No signup, no watermark.
There's a maker for pretty much any chart you'd put in an email: a funnel chart for a conversion recap, a bullet chart for goal-versus-actual, a calendar heatmap for activity, or a radar chart for a scorecard. Download it, upload it to your email tool or CDN, and embed the URL. Done in about two minutes.
The automated way a chart image apiThe automated way: a chart image API
Now the interesting part. What if the chart should be different for every recipient?
"Here's your usage this month." "You hit 82% of your goal." "Your spend by category." That's where a static PNG can't help you, and where a chart image API earns its keep. You design the chart one time, mark the data dynamic, and generate a fresh image per person at send time.
With Imejis, you build the chart in the editor (or start from one of the 24 chart types), then POST each recipient's data to a single endpoint:
curl -X POST 'https://render.imejis.io/v1/YOUR_DESIGN_ID' \
  -H 'dma-api-key: YOUR_API_KEY' \
  -H 'Content-Type: application/json' \
  -d '{ "usage_chart": { "data": [12, 40, 28, 55], "labels": ["Wk1","Wk2","Wk3","Wk4"] } }'
You get back an image. Point your email template's <img src> at it (most email platforms let you use a merge field for the URL), and every subscriber opens their own chart. No designer in the loop, no manual exports, no blank boxes.
The pricing is the part people don't expect: 100 image calls a month are free, forever, and paid plans start at $14.99/month for 1,000. At that tier you're paying about a penny and a half per personalized chart. Compare that to a designer's hourly rate for, say, a thousand of them.
Email client gotchas worth knowingEmail-client gotchas worth knowing
A few things I've watched break real sends. Save yourself the debugging.
- PNG, not SVG. I said it above but it's worth repeating, because it's the single most common mistake. SVG looks tempting (small, sharp) and then vanishes in Outlook. Ship PNG.
- Export at 2x. Design the chart at 1200px wide, then set
width="600"in the tag. Retina screens will thank you, and the chart won't look fuzzy. - Set an explicit width on the img. Outlook has opinions about image sizing. Give it a fixed pixel width so it doesn't blow the chart up to full column.
- Mind dark mode. Some clients invert colors in dark mode and can turn your clean chart into mud. A chart on a solid card background survives this better than one on a transparent PNG.
- Keep the file reasonable. A 600px chart PNG should be well under 200KB. Huge images load slowly on mobile and some clients clip them.
Which approach should you pickWhich approach should you pick?
Quick gut check:
- One static chart, sent occasionally: screenshot it or use a free chart tool. Don't overthink it.
- You love config and want open-source: QuickChart.
- The chart changes with your data, or it's different per recipient: a chart image API. This is the whole reason Imejis exists, and it's the only one of these that pairs a visual editor with the API so a non-developer can build the template.
For most teams sending product or marketing email, the deciding question isn't "can it draw a bar chart." It's "will this still be correct next month without someone remaking it by hand." An image API answers that. A screenshot doesn't.
The takeawayThe takeaway
Charts don't render in HTML email because email strips the JavaScript and canvas that chart libraries need. Once you accept that, the fix is easy: send the chart as a hosted PNG and embed it with an <img> tag. Make that PNG by hand for a one-off, or generate it from data with an API when it needs to stay current or personalized.
If you want to try the automated route, you get 100 free chart images a month, or you can make one right now with the free chart tools, no signup required. And if you're still deciding which chart image API fits, the best chart image API comparison breaks down the options.