
New Component - Funnel Charts
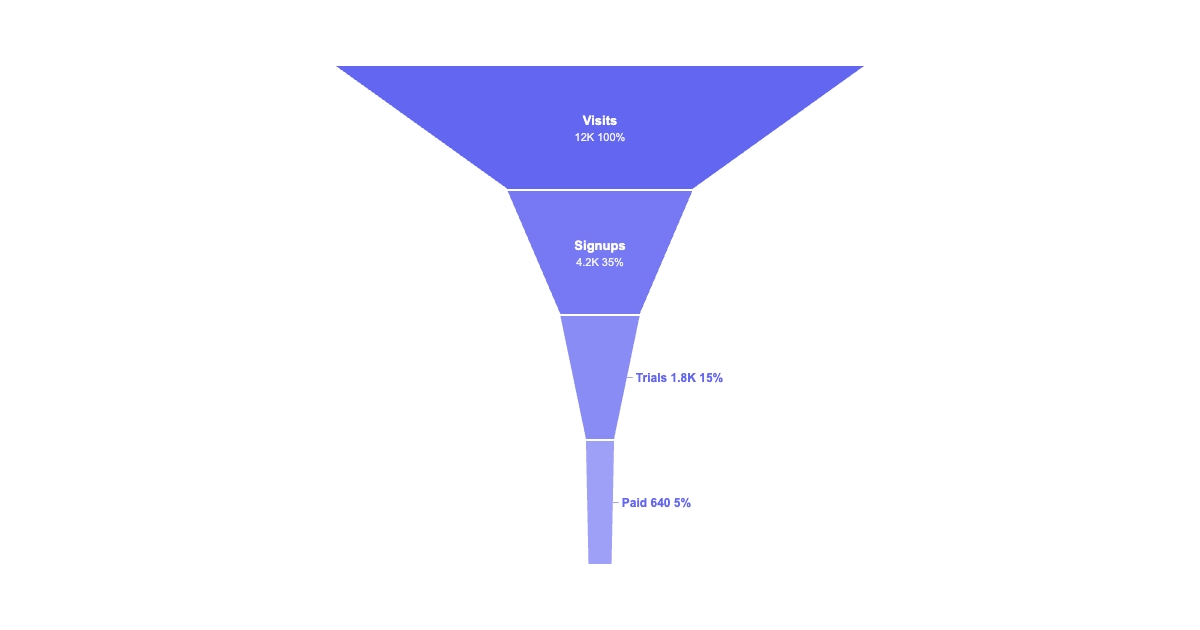

New component funnelNew Component: Funnel
Every growth report has a funnel in it. Now you can render one straight into an image and refresh it with live numbers on every call.
The dataThe data
It's a simple array of stages: { label, value }, top to bottom. Each band is sized to its value, so the drop-off between stages is obvious at a glance. Turn on showPercent to print conversion rates. percentOf: "first" shows each stage as a share of the top, and "previous" shows step-to-step conversion.
Colors and legibilityColors and legibility
Give each stage its own color, or set a single base color that fades lighter down the funnel. Here's the nice part: when a stage gets too narrow to hold its label, the label moves beside the band with a small leader line. So even a 5%-of-the-top "Paid" stage stays readable.
Dynamic data per renderDynamic data, per render
POST https://render.imejis.io/v1/<design-id>
{ "signups.data": [
  { "label": "Visits", "value": 12000 },
  { "label": "Signups", "value": 4200 },
  { "label": "Trials", "value": 1800 },
  { "label": "Paid", "value": 640 }
] }
Signup and activation funnels for growth digests, sales-pipeline snapshots for CRM emails, checkout drop-off for e-commerce, hiring pipelines for recruiting.
Try itTry it
It's under Data in the editor palette, with a live playground on the funnel component page.