
New Component - Sankey Flow Diagrams
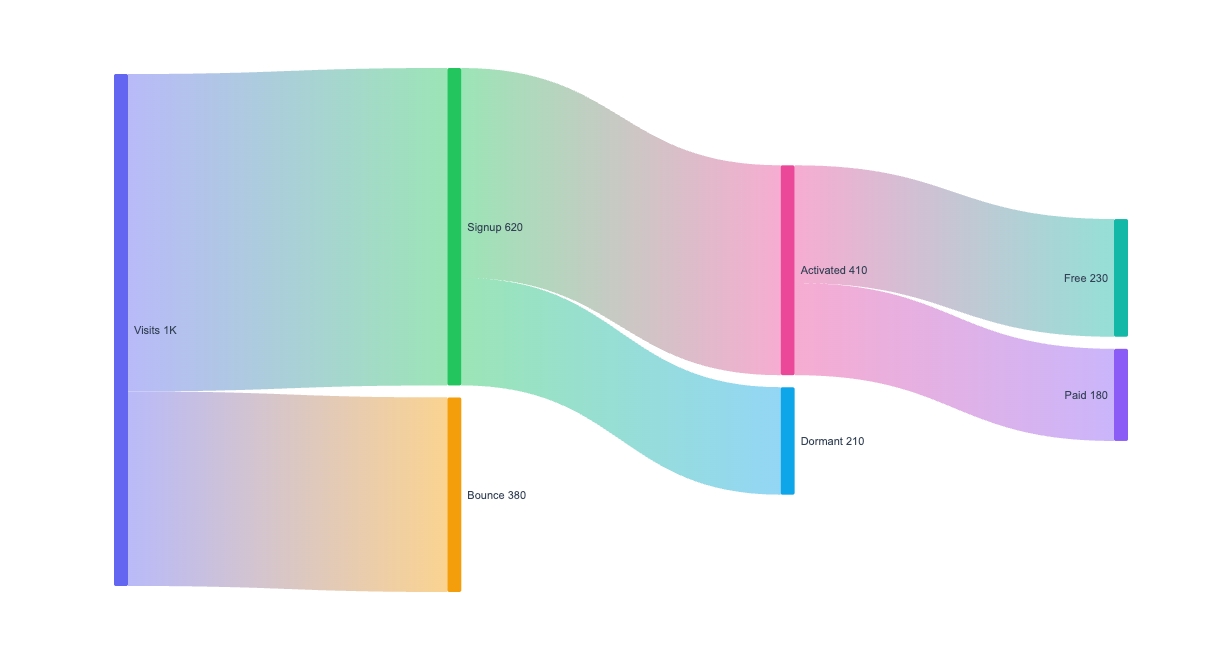

New component sankeyNew Component: Sankey
Some stories are about flow: where users go, where the budget lands, where the energy is lost. A Sankey diagram shows the whole thing in one picture, and now you can render one from a flat list of flows.
The dataThe data
It's just links: { source, target, value }. Nodes are matched by name and placed into columns automatically by flow direction, so you don't lay anything out. You describe the flows and the layout falls out. Band width is proportional to value, and the columns get ordered to keep crossings low.
ColoringColoring
linkColorMode: "gradient" blends each band from its source color to its target color for a polished look. "source" or "target" gives flat bands that read cleaner on dense diagrams. Node colors come from a palette or per-node overrides, and showValues prints each node's total.
Dynamic data per renderDynamic data, per render
POST https://render.imejis.io/v1/<design-id>
{ "flow.links": [
  { "source": "Visits", "target": "Signup", "value": 620 },
  { "source": "Visits", "target": "Bounce", "value": 380 },
  { "source": "Signup", "target": "Paid",   "value": 180 }
] }
User-journey and conversion-path flows, budget and spend allocation, traffic source to page to outcome, energy and material flows.
Try itTry it
It's under Data in the editor palette, with a live playground on the sankey component page.