
New Components - Metric Tiles & Data Tables

New components metric tiles data tablesNew Components: Metric Tiles & Data Tables
The data component family got its two most requested members. One shows a single number well. The other shows a whole grid of them.
The metric componentThe metric component
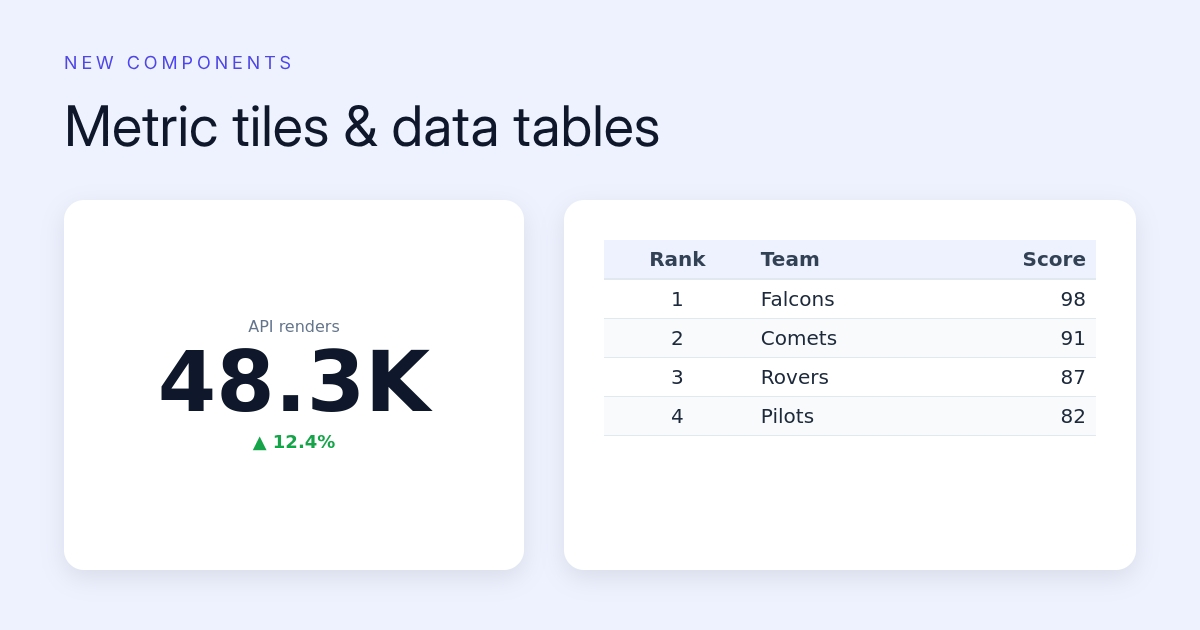
A stat tile: one big formatted number, an optional label, and an up/down delta badge. Formats cover plain numbers, compact (48.3K), percent, currency with your own symbol, or raw text with a prefix/suffix. The delta badge colors itself by direction, and you can flip what "good" means: for a revenue counter up is green, for a support-ticket count you'd set down-good and a drop shows green instead.
Revenue counters, follower milestones, weekly scorecards. The number and the delta are both dynamic fields, so a scheduled job can render your Monday metrics image with zero manual work.
The table componentThe table component
A real data grid: header row, striped rows, per-column alignment, and configurable borders (all cells, horizontal rules only, or none). The auto alignment mode right-aligns numbers and left-aligns text per column, which is one of those tiny things that makes a table look professionally set. Header, row, and grid colors are all adjustable, and there are ready-made styles for grid borders, minimal, and dark header looks.
Feed it per render:
POST https://render.imejis.io/v1/<design-id>
{ "standings.rows": [["1", "Falcons", 98], ["2", "Comets", 91]] }
Leaderboards, price lists, order summaries, match results. Rows and headers both swap out per request.
Try themTry them
Both live in the editor palette under Data. The metric and table pages have interactive playgrounds, property references, and copy-paste API examples.