
Map - Bubble, Categorical and Labels
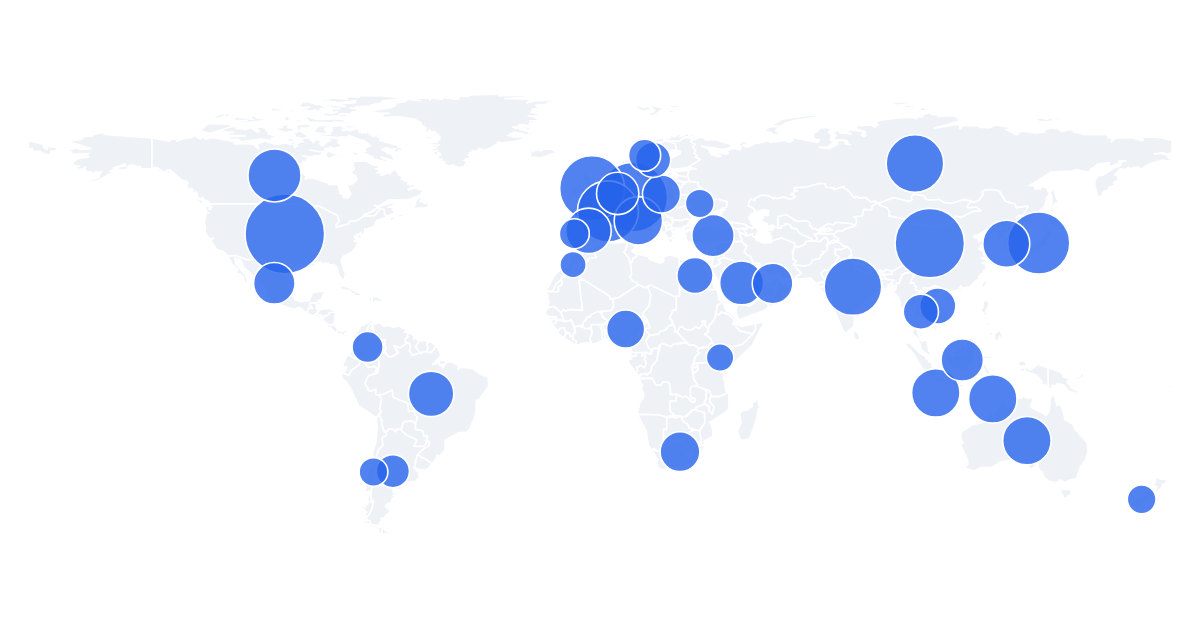

Three new ways to read a mapThree new ways to read a map
The map started as a choropleth: shade each region by a number. That answers "how much, where," but not every question is a number on a color ramp. So the map now does three more things, and they all work on the same seven basemaps.
Bubble modeBubble mode
Set mode: "bubble" and the map draws a flat basemap with a circle at each region's center, sized by value. Circles are area-proportional, so a value twice as large looks twice as big, not twice as wide. It's the right pick when a count matters more than a shade, like stores per state or users per country.
POST https://render.imejis.io/v1/<design-id>
{ "map.mode": "bubble",
  "map.data": [
    { "id": "US", "value": 920 },
    { "id": "DE", "value": 700 },
    { "id": "IN", "value": 480 }
] }
Categorical coloringCategorical coloring
Set colorMode: "categorical" and add a category to each row, and the map colors regions by group instead of by a numeric scale. Think sales regions (Americas, EMEA, APAC), plan tiers, or status. Colors come from a built-in palette, or pass your own in colors, and the legend lists the categories.
Region labelsRegion labels
Turn on showLabels to print each region's value (or its name, with labelField: "name") right on the map. Labels are drawn inside the SVG with a subtle outline, so they stay put and stay legible when you export a PNG or SVG.
Try themTry them
All three are in the editor's Map panel and in the free map maker, with a live playground on the map component page. Mix and match: a bubble map colored by category with labels on is a single design.