
New Component - Gantt Charts
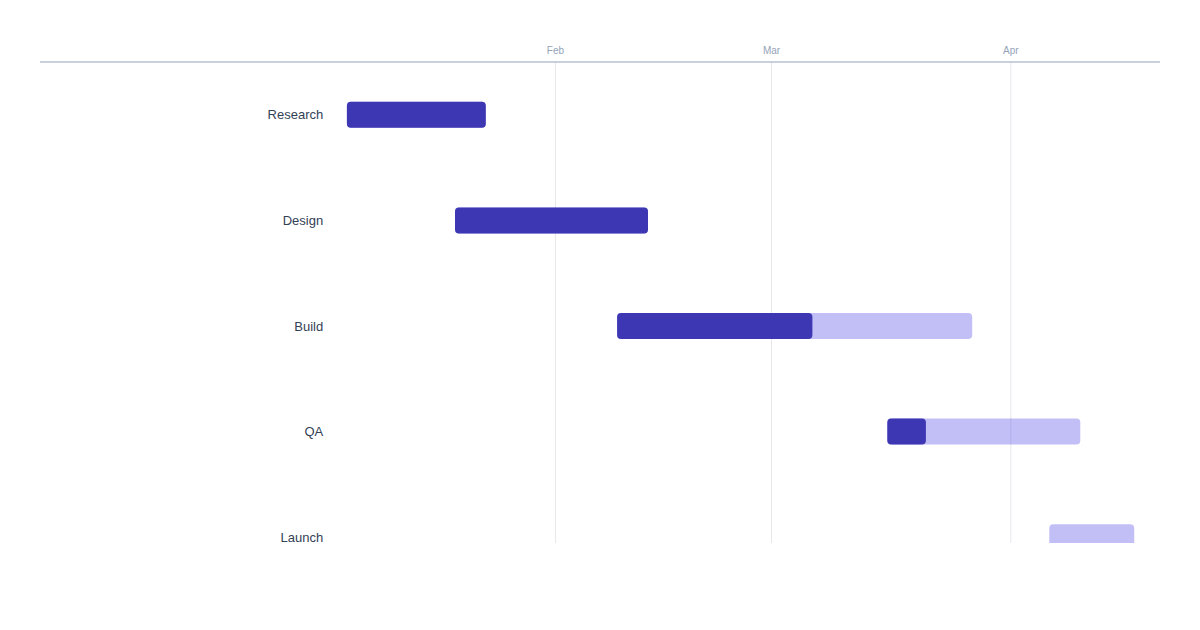

New component ganttNew Component: Gantt
Most plans start life as a list of tasks with dates, and end up as a screenshot someone pasted into a deck. The Gantt component skips the screenshot. You send the tasks, it draws the timeline.
The dataThe data
One object per task: { label, start, end }, with an optional progress and color. The start and end place the bar on a shared axis and set its length, so the schedule is baked into the numbers. They take an ISO date like "2026-01-15" for a real calendar, or a plain number such as a day or week index for a generic timeline. The axis labels adapt to whichever you send.
Progress and colorProgress and color
Give a task a progress from 0 to 100 and its bar draws a darker filled portion for the completed part. Leave it off and the bar stays solid, so a plan can mix done, in-flight and not-yet-started work in one picture. Add a color to any task to group bars by team, owner or phase; tasks without one fall back to the shared bar color.
Dynamic data per renderDynamic data, per render
POST https://render.imejis.io/v1/<design-id>
{ "gantt.data": [
  { "label": "Research", "start": "2026-01-05", "end": "2026-01-23", "progress": 100 },
  { "label": "Build",    "start": "2026-02-09", "end": "2026-03-27", "progress": 55 },
  { "label": "Launch",   "start": "2026-04-06", "end": "2026-04-17", "progress": 0 }
] }
Point an image at the render URL and a status timeline in a weekly report or a shared doc stays current on its own as you push fresh tasks.
Try itTry it
It's under Data in the editor palette, with a live playground on the gantt component page, or start from the free gantt chart maker.