
New Component - Chord Diagrams
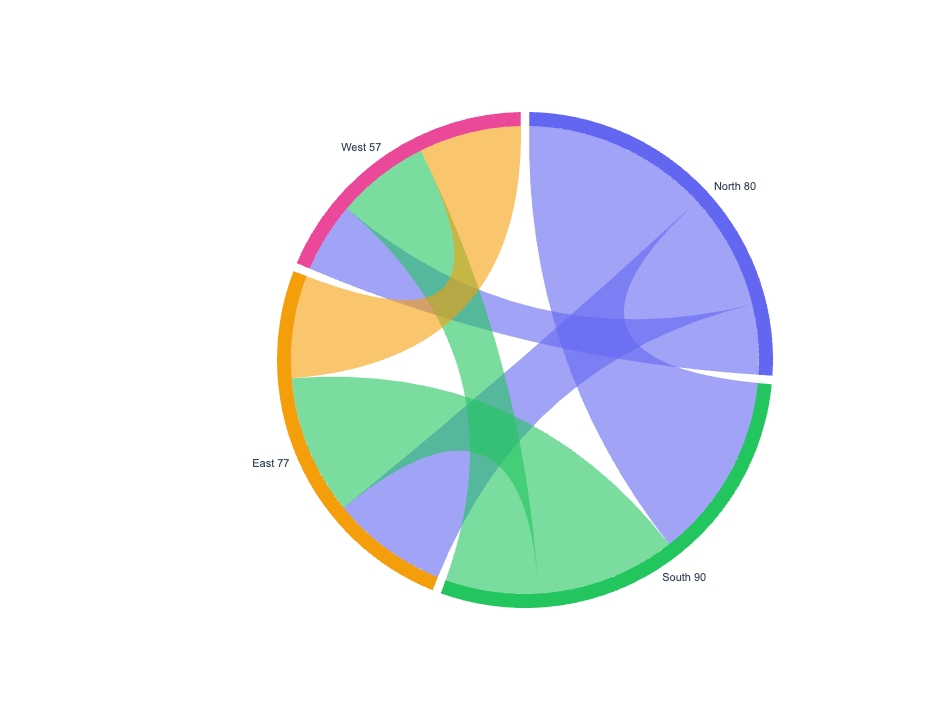

New component chordNew Component: Chord
Some data isn't a flow from A to B. It's a web of connections between everything: migration between regions, trade between markets, how often teams work together. A chord diagram wraps all of it around a circle.
The dataThe data
It uses the same friendly shape as Sankey, { source, target, value }, but reads them as relationships rather than directed flows. Groups get placed around the circle automatically, each arc sized to that group's total weight, and a ribbon connects every related pair with thickness proportional to its value. Self-relationships (source equals target) are skipped.
StylingStyling
You get adjustable arc thickness and group gap, ribbon opacity, per-group colors or a palette (ribbons take their source group's color), and optional group totals in the labels.
Dynamic data per renderDynamic data, per render
POST https://render.imejis.io/v1/<design-id>
{ "relations.links": [
  { "source": "North", "target": "South", "value": 40 },
  { "source": "North", "target": "East",  "value": 25 },
  { "source": "South", "target": "West",  "value": 30 }
] }
Migration and trade flows between regions, cross-team or cross-product interaction maps, referral and co-occurrence relationships.
Try itTry it
It's under Data in the editor palette, with a live playground on the chord component page.