
New Component - Calendar Heatmaps
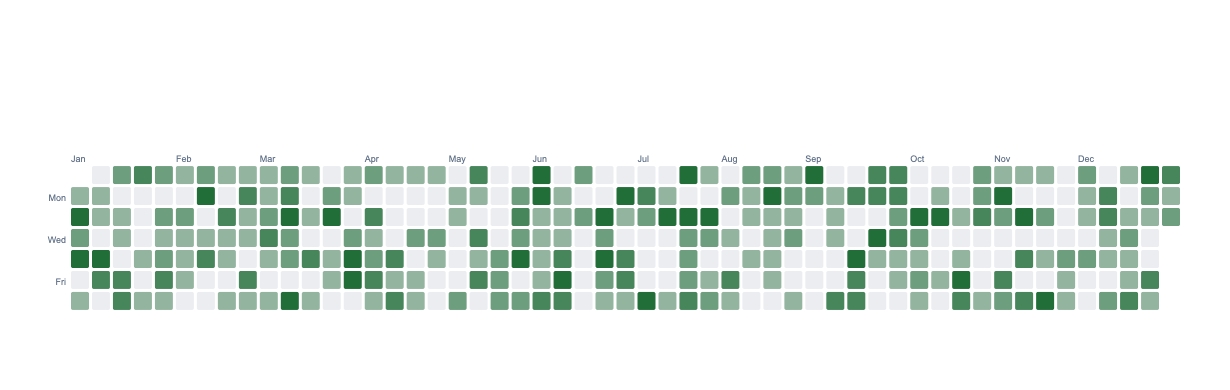

New component calendar heatmapNew Component: Calendar Heatmap
Everyone recognizes the green contribution grid on a GitHub profile. It's now a component you can render from your own data: commits, workouts, sales, daily returns, anything with a date.
The dataThe data
An array of { date, value }, one entry per active day, laid out in week columns with month and weekday labels. Missing days render empty, so a sparse habit tracker looks right without filler.
colorMode: "ramp" colors by intensity in one hue. It defaults to the classic GitHub green scale, and you can pass your own colors levels or a baseColor for any brand.
colorMode: "diverging" colors signed values red for down and green for up, which is perfect for daily returns or over/under-goal calendars.
Pin the window with startDate/endDate (a full calendar year, say), or let it fit the data.
Dynamic data per renderDynamic data, per render
POST https://render.imejis.io/v1/<design-id>
{ "activity.data": [
  { "date": "2024-01-06", "value": 3 },
  { "date": "2024-01-07", "value": 8 },
  { "date": "2024-01-10", "value": 12 }
] }
"Year in review" cards, streak and habit graphics, daily-metric summaries, P&L and returns calendars.
Try itTry it
It's under Data in the editor palette, with a live playground on the calendar component page.