---
title: "Chart Image From Google Sheets (Auto-Updating)"
description: "Chart image from Google Sheets, made automatic: pull your sheet data into a PNG chart that updates itself, ready for email, Slack, reports, or the sheet."
url: "https://www.imejis.io/blogs/use-cases/chart-image-from-google-sheets"
image: "https://www.imejis.io/images/blog/gsheets-revenue-chart.jpg"
published: "2026-07-24"
---
# Chart Image From Google Sheets (Auto-Updating)
Your data lives in Google Sheets. The chart needs to live somewhere else: a weekly email, a Slack post, a client report, a dashboard, a PDF. And it can't be a screenshot you redo every Monday, because the numbers change.
This is one of those tasks that sounds trivial and then eats an afternoon. Sheets makes charts fine. Getting one out as an image that stays current? That's the annoying part.
Here's how to get a chart image from Google Sheets, from the two-minute manual version to a PNG that rebuilds itself every time the sheet changes.
## Why this is harder than it should be
Google Sheets charts are live objects. They're interactive inside the sheet, drawn by Google's own rendering. That's great in the browser and useless the moment you need the chart _outside_ the browser.
Three things get in the way:
- **The export is manual.** You can download a chart as a PNG (we'll cover it below), but it's a menu click you have to repeat by hand. Fine once. Painful weekly. Impossible at scale.
- **The charts look like Sheets.** Google's default styling is functional, not designed. Drop it into a polished client report and it sticks out.
- **Nothing updates automatically.** A downloaded PNG is a snapshot. The sheet moves on; the image doesn't. Next week you're back in the menu.
So the real goal isn't "make a chart." It's "get a chart image that reflects the current data, without me babysitting it." There are a few ways there.
## The options, honestly
| Approach | Automatic | Good-looking output | Works outside Google | Effort |
| ----------------------------- | :-------: | :-----------------: | :------------------: | ------------------------ |
| Download as PNG by hand | No | Default Sheets | Yes | Manual, every time |
| Google Apps Script | Yes | Default Sheets | Email/Drive only | Medium: write the script |
| Chart image API + Sheets data | Yes | Designed | Yes, anywhere | Low once set up |
Each has a place. Let me walk through them.
## Option 1: Download as PNG (the manual way)
For a one-off, this is genuinely the answer. Don't overbuild it.
1. In your sheet, select the data and go to **Insert, then Chart**.
2. Click the chart, open the **three-dot menu** in its top corner.
3. Pick **Download, then PNG image**.
You've got a PNG. Drop it wherever. Total time: about a minute. If you send this chart once a quarter and the data barely moves, stop here. Seriously.
It stops working the second you need it often, or need it to look better than Sheets-default, or need it somewhere automated. That's the other two options.
## Option 2: Google Apps Script (staying inside Google)
If the chart only ever needs to land in an email or Google Drive, Apps Script can automate the export without leaving Google. You grab the chart object and convert it to a PNG blob:
```javascript
function emailWeeklyChart() {
const sheet = SpreadsheetApp.getActiveSpreadsheet().getSheetByName("Report")
const chart = sheet.getCharts()[0]
const png = chart.getAs("image/png")
MailApp.sendEmail({
to: "team@example.com",
subject: "Weekly numbers",
htmlBody: "This week's chart:
 ",
inlineImages: { chart: png },
})
}
```
Set that on a time-driven trigger and it emails a fresh chart every week. Free, no third-party anything.
The catch is what you saw in the table: the chart still looks like a Google chart, and this really only helps for email or Drive. You're also now maintaining Apps Script code. For a lot of teams that's fine. For "I want a branded chart on our dashboard and in Slack," it's not enough.
## Option 3: A chart image API (the flexible way)
Here's where it gets good. You separate the two jobs: Sheets holds the data, and a chart image API turns that data into a designed PNG you can send anywhere. Because it's just an image URL, it works in email, Slack, Notion, a PDF, a dashboard, or even back inside the sheet.
The pattern has two halves.
### Get the data out of the sheet
The no-auth trick: publish the sheet as CSV. Go to **File, then Share, then Publish to web**, pick the tab, and choose **Comma-separated values (.csv)**. You get a URL that returns the current values:
```bash
curl "https://docs.google.com/spreadsheets/d/e/YOUR_ID/pub?gid=0&single=true&output=csv"
# Region,Q1,Q2
# North,120,180
# South,90,140
```
Two things to know: it caches for a few minutes, and it's public, so only use it for data you're okay sharing. For private data, read cells with the [Google Sheets API](https://developers.google.com/sheets/api) instead (it needs auth but keeps the sheet private).
### Turn the data into a chart image
Design the chart once as a template, mark its data dynamic, then POST your parsed values to a single endpoint:
```http
POST https://render.imejis.io/v1/YOUR_DESIGN_ID
{ "revenue": { "data": [120, 180, 90, 140], "labels": ["North Q1", "North Q2", "South Q1", "South Q2"] } }
```
You get back a PNG. Here's the actual image that sample data produces, no manual charting involved:
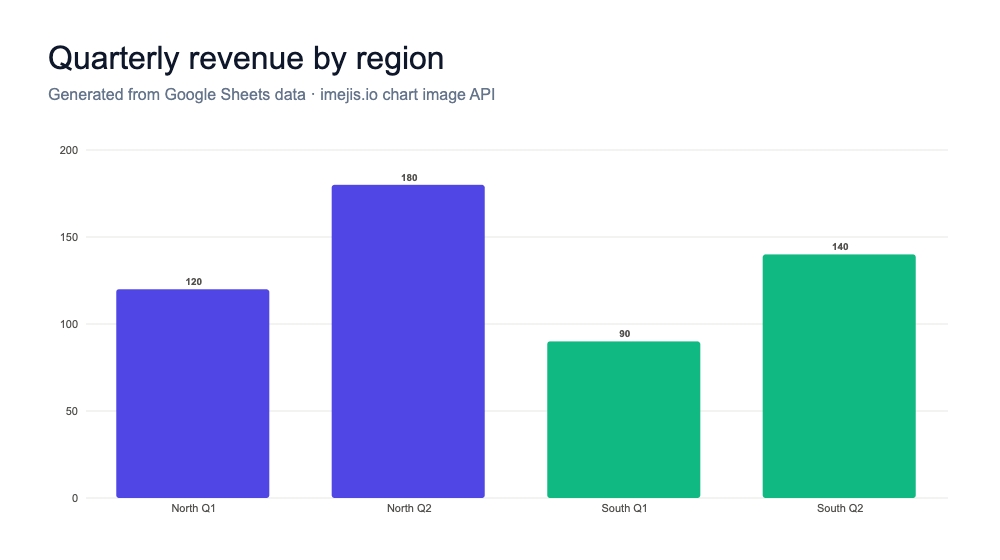
That's the whole loop: read the sheet, POST the numbers, embed the image. Run it on a schedule (a cron job, a Zap, an Apps Script trigger that calls the API) and the chart stays current with zero manual steps.
Prefer not to touch code at all? For a one-off, copy your cells straight into a [free chart tool](/tools), pick a type, and download the PNG. There's a maker for whatever your data wants to be: a [funnel chart](/tools/funnel-chart-maker), a [treemap](/tools/treemap-generator) for a market breakdown, a [calendar heatmap](/tools/calendar-heatmap-generator), or any of the [24 chart types](/components). No signup.
## Bonus: put the chart back _inside_ the sheet
This one surprises people. Google Sheets has an `=IMAGE()` formula that renders any image URL right in a cell. Point it at a chart image endpoint and you get a live chart sitting in your grid:
```text
=IMAGE("https://render.imejis.io/v1/YOUR_DESIGN_ID?revenue=...")
```
Now the chart lives next to the data it's built from, and it refreshes when the sheet recalculates. It's a neat way to give a designed chart to people who never leave the spreadsheet.
## Gotchas worth knowing
- **The published CSV caches.** Google holds it for roughly five minutes, so a brand-new edit won't show instantly. Fine for hourly or daily reports, not for real-time.
- **Watch your ranges.** If rows get added below your data, make sure whatever reads the sheet grabs the full range, not a fixed `A1:C5`.
- **Private data needs the API, not publish-to-web.** Publishing makes the tab public. For anything sensitive, use the Sheets API with a service account.
- **Match labels to values.** The most common bug is sending 4 data points and 3 labels. Parse carefully.
## Which one should you use?
Quick gut check:
- **One chart, once**: download it as a PNG. Move on.
- **Automated, and it only needs to hit email or Drive**: Google Apps Script.
- **Automated, and it needs to look designed and go anywhere (Slack, email, dashboards, the sheet itself)**: a [chart image API](/apis). This is the one that scales and the only one where a non-developer can build the template in an editor.
For most reporting workflows, the question that decides it is: "will this chart still be right next month without me touching it?" Manual download says no. The API says yes.
## Wrapping up
A chart image from Google Sheets comes down to separating data from rendering. Sheets is a great place to keep numbers and a poor place to keep a chart image that needs to travel. Download a PNG for a one-off, script it with Apps Script if you live in Google, or pipe the data to a chart image API when the chart has to look good, stay current, and show up in five different places.
Start free with [100 chart images a month](/pricing), or make one right now with the free [chart tools](/tools). And if you're sending these charts in email, read [how to add charts to HTML email](/blogs/use-cases/html-email-charts) next, because that's the one place they break in a way you won't expect.
",
inlineImages: { chart: png },
})
}
```
Set that on a time-driven trigger and it emails a fresh chart every week. Free, no third-party anything.
The catch is what you saw in the table: the chart still looks like a Google chart, and this really only helps for email or Drive. You're also now maintaining Apps Script code. For a lot of teams that's fine. For "I want a branded chart on our dashboard and in Slack," it's not enough.
## Option 3: A chart image API (the flexible way)
Here's where it gets good. You separate the two jobs: Sheets holds the data, and a chart image API turns that data into a designed PNG you can send anywhere. Because it's just an image URL, it works in email, Slack, Notion, a PDF, a dashboard, or even back inside the sheet.
The pattern has two halves.
### Get the data out of the sheet
The no-auth trick: publish the sheet as CSV. Go to **File, then Share, then Publish to web**, pick the tab, and choose **Comma-separated values (.csv)**. You get a URL that returns the current values:
```bash
curl "https://docs.google.com/spreadsheets/d/e/YOUR_ID/pub?gid=0&single=true&output=csv"
# Region,Q1,Q2
# North,120,180
# South,90,140
```
Two things to know: it caches for a few minutes, and it's public, so only use it for data you're okay sharing. For private data, read cells with the [Google Sheets API](https://developers.google.com/sheets/api) instead (it needs auth but keeps the sheet private).
### Turn the data into a chart image
Design the chart once as a template, mark its data dynamic, then POST your parsed values to a single endpoint:
```http
POST https://render.imejis.io/v1/YOUR_DESIGN_ID
{ "revenue": { "data": [120, 180, 90, 140], "labels": ["North Q1", "North Q2", "South Q1", "South Q2"] } }
```
You get back a PNG. Here's the actual image that sample data produces, no manual charting involved:

That's the whole loop: read the sheet, POST the numbers, embed the image. Run it on a schedule (a cron job, a Zap, an Apps Script trigger that calls the API) and the chart stays current with zero manual steps.
Prefer not to touch code at all? For a one-off, copy your cells straight into a [free chart tool](/tools), pick a type, and download the PNG. There's a maker for whatever your data wants to be: a [funnel chart](/tools/funnel-chart-maker), a [treemap](/tools/treemap-generator) for a market breakdown, a [calendar heatmap](/tools/calendar-heatmap-generator), or any of the [24 chart types](/components). No signup.
## Bonus: put the chart back _inside_ the sheet
This one surprises people. Google Sheets has an `=IMAGE()` formula that renders any image URL right in a cell. Point it at a chart image endpoint and you get a live chart sitting in your grid:
```text
=IMAGE("https://render.imejis.io/v1/YOUR_DESIGN_ID?revenue=...")
```
Now the chart lives next to the data it's built from, and it refreshes when the sheet recalculates. It's a neat way to give a designed chart to people who never leave the spreadsheet.
## Gotchas worth knowing
- **The published CSV caches.** Google holds it for roughly five minutes, so a brand-new edit won't show instantly. Fine for hourly or daily reports, not for real-time.
- **Watch your ranges.** If rows get added below your data, make sure whatever reads the sheet grabs the full range, not a fixed `A1:C5`.
- **Private data needs the API, not publish-to-web.** Publishing makes the tab public. For anything sensitive, use the Sheets API with a service account.
- **Match labels to values.** The most common bug is sending 4 data points and 3 labels. Parse carefully.
## Which one should you use?
Quick gut check:
- **One chart, once**: download it as a PNG. Move on.
- **Automated, and it only needs to hit email or Drive**: Google Apps Script.
- **Automated, and it needs to look designed and go anywhere (Slack, email, dashboards, the sheet itself)**: a [chart image API](/apis). This is the one that scales and the only one where a non-developer can build the template in an editor.
For most reporting workflows, the question that decides it is: "will this chart still be right next month without me touching it?" Manual download says no. The API says yes.
## Wrapping up
A chart image from Google Sheets comes down to separating data from rendering. Sheets is a great place to keep numbers and a poor place to keep a chart image that needs to travel. Download a PNG for a one-off, script it with Apps Script if you live in Google, or pipe the data to a chart image API when the chart has to look good, stay current, and show up in five different places.
Start free with [100 chart images a month](/pricing), or make one right now with the free [chart tools](/tools). And if you're sending these charts in email, read [how to add charts to HTML email](/blogs/use-cases/html-email-charts) next, because that's the one place they break in a way you won't expect.